Case studies Trading Cockpit
Every figure traced to a fill.
- Role
- Designer, sole developer
- Period
- 2026 – present
- Stack
- React 19 · Vite · Firebase Auth / Firestore / Functions · IndexedDB · vitest
A private, single-user trading-analytics app for one futures day trader: broker export in, round trips rebuilt by first-in first-out pairing, every analytic withheld until the file reconciles to itself. Advisory only. It never executes a trade.
The problem
A futures day trader gets a Performance export from the broker: one row per matched buy-and-sell pair, no account column, no fees per trade, and nothing that says whether the first or last trade of the file was really complete. Every journaling tool I looked at either asked me to retype what the file already held, or took the file and drew conclusions from it that the file could not support.
The brief I set myself: import once, reconcile once, and reuse the reliable facts everywhere. Every figure on every screen traces back to a fill, and anything the data cannot prove is said out loud rather than estimated. The app is advisory only. It never sizes a trade, never routes an order, and never connects to a broker for execution.
Ingestion and normalisation
The reader is a strict RFC 4180 parser with no DOM and no network: quoted fields, escaped quotes, line breaks inside quotes, every line-ending convention and a leading byte-order mark. Each record keeps the physical line it started on, so an import problem points at the exact row in the file, and nothing is coerced at this layer; typed parsing of money, prices and timestamps belongs to the report contract.
Rows become immutable matched lots keyed by their buy and sell fill ids, under an account label the trader types (the export does not carry one, and trades from different accounts must never be combined). Overlapping exports union; a row that repeats exactly is counted once; a row that disagrees with an earlier copy of the same fills is a conflict, and a conflict fails reconciliation rather than being resolved by guesswork.
FIFO reconstruction
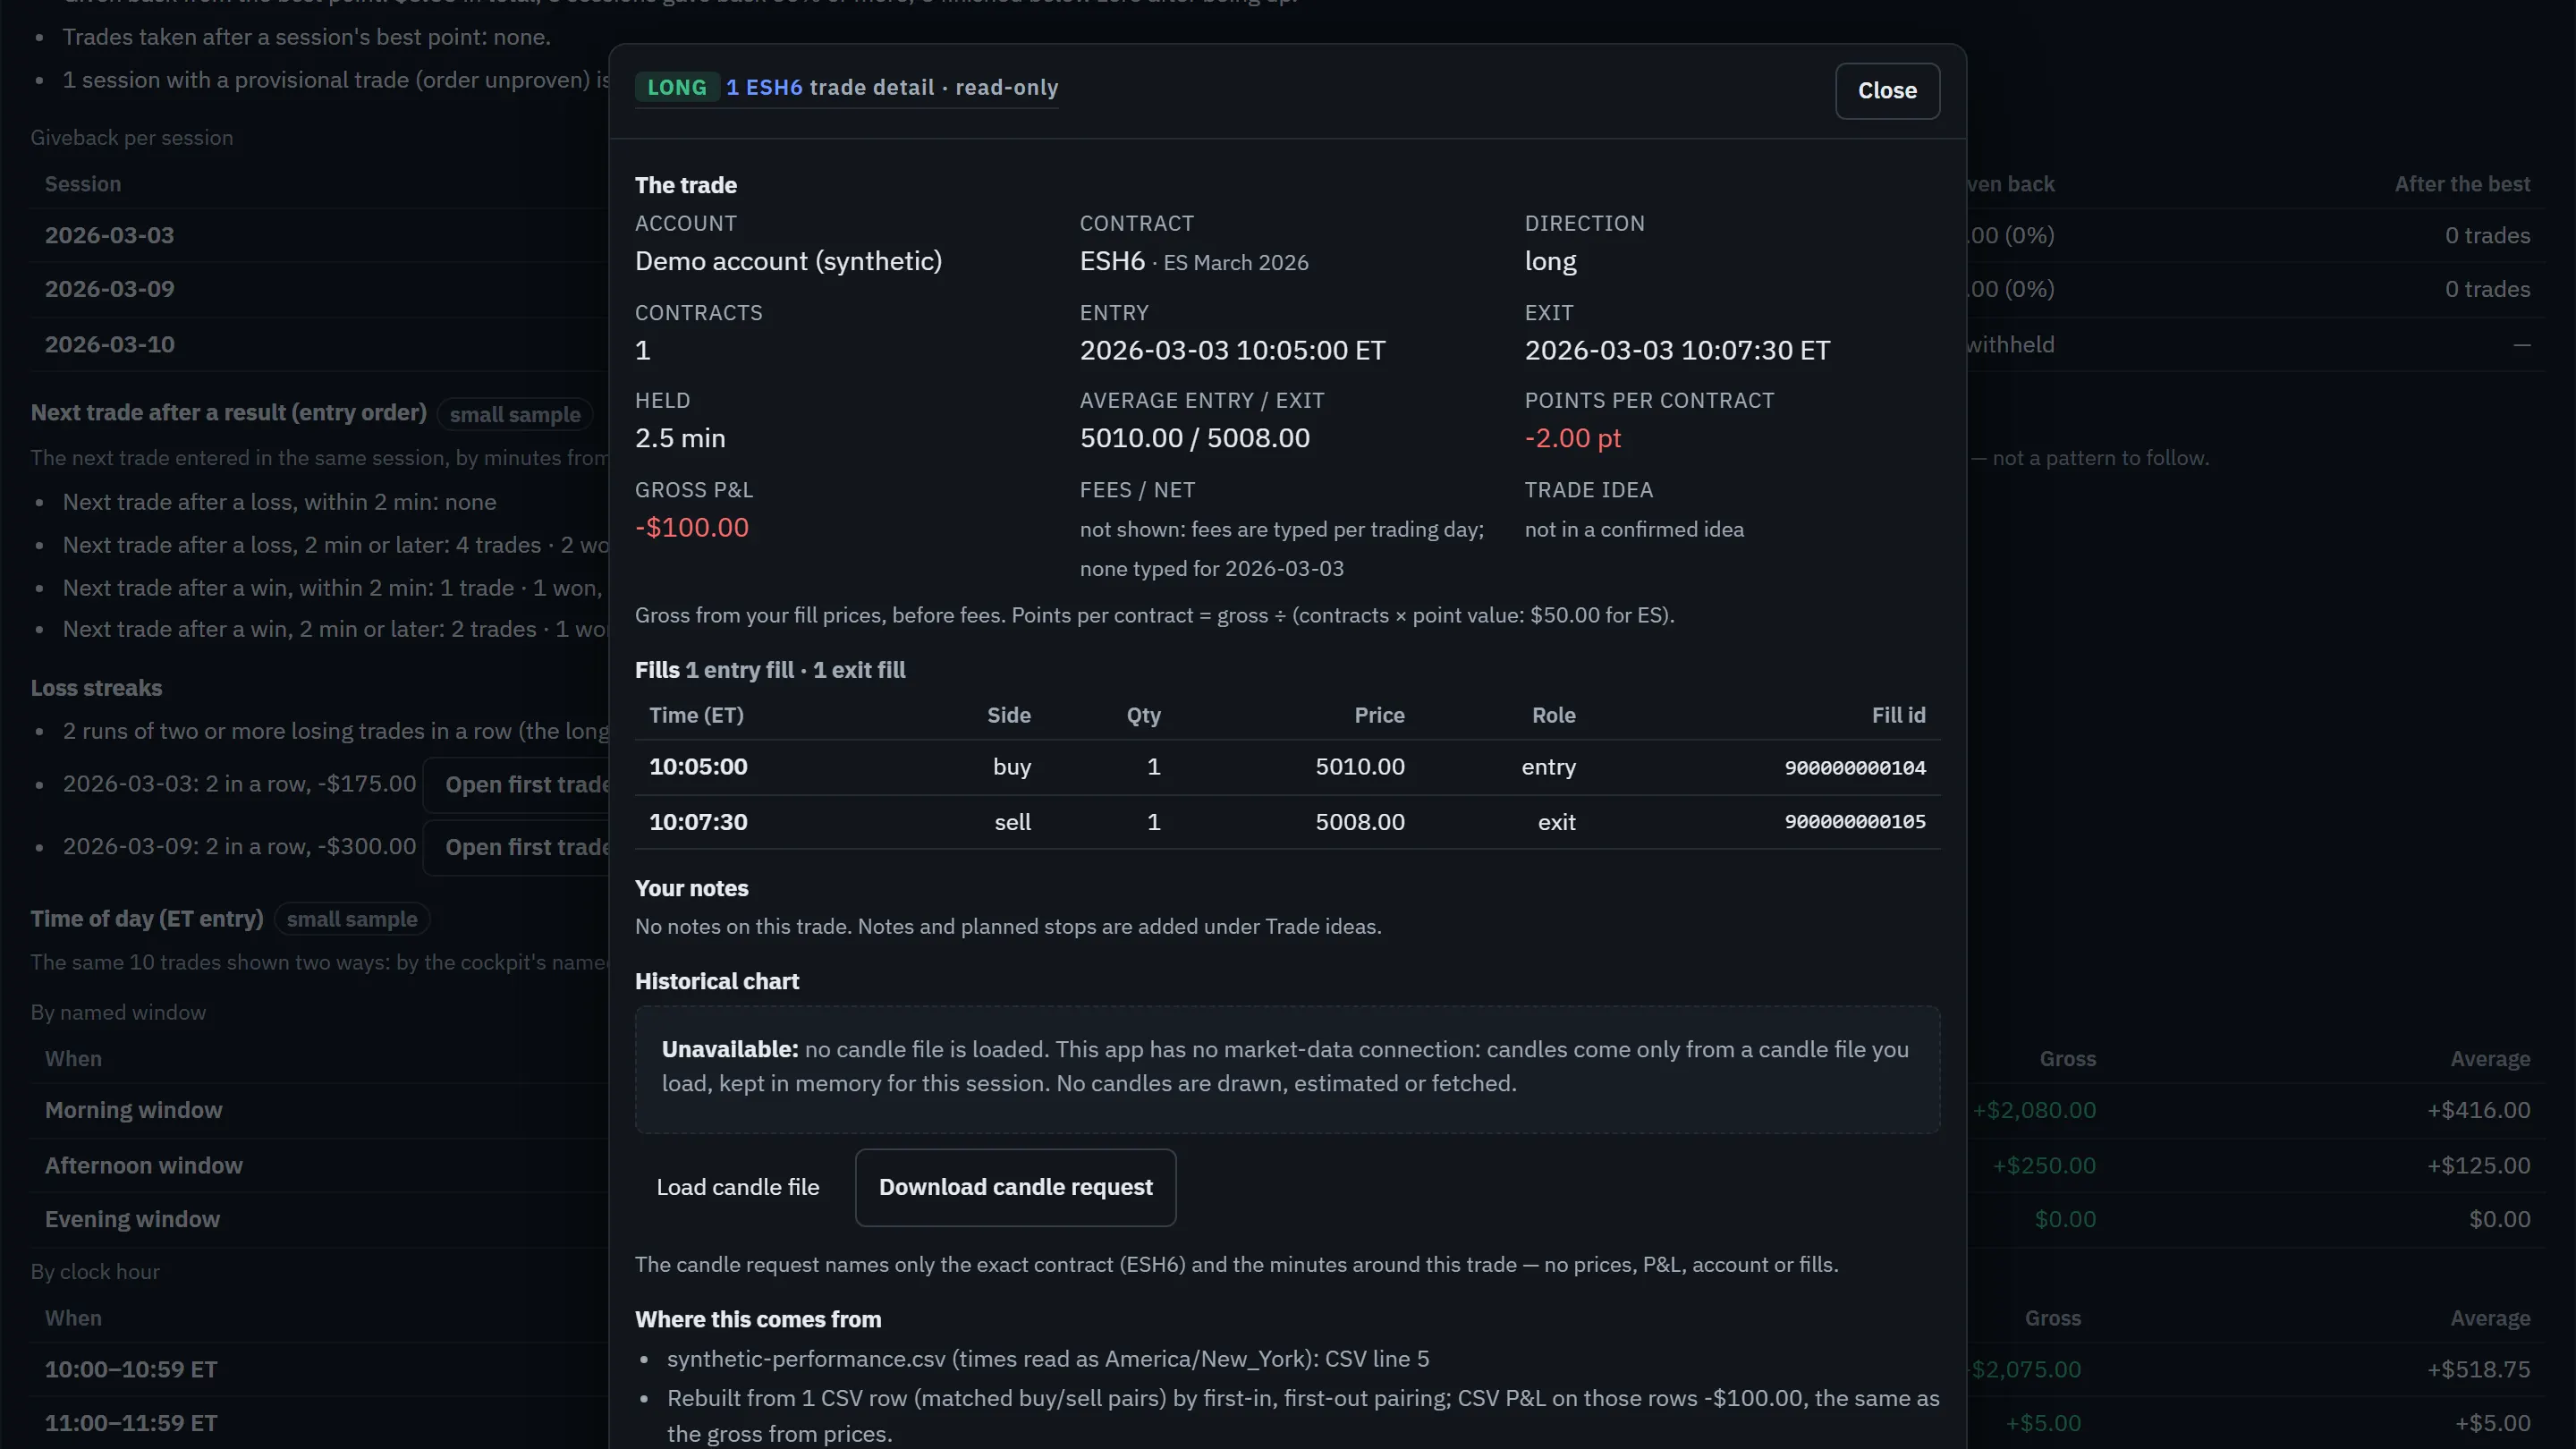
Six layers are kept distinct and never interchangeable: the source row, the matched lot, the fill (rebuilt by merging lots that share a fill id, quantities summed), the leg (the part of a fill inside one round trip), the completed round trip (flat to flat on one account and one contract), and the trade idea, which only the trader can confirm.
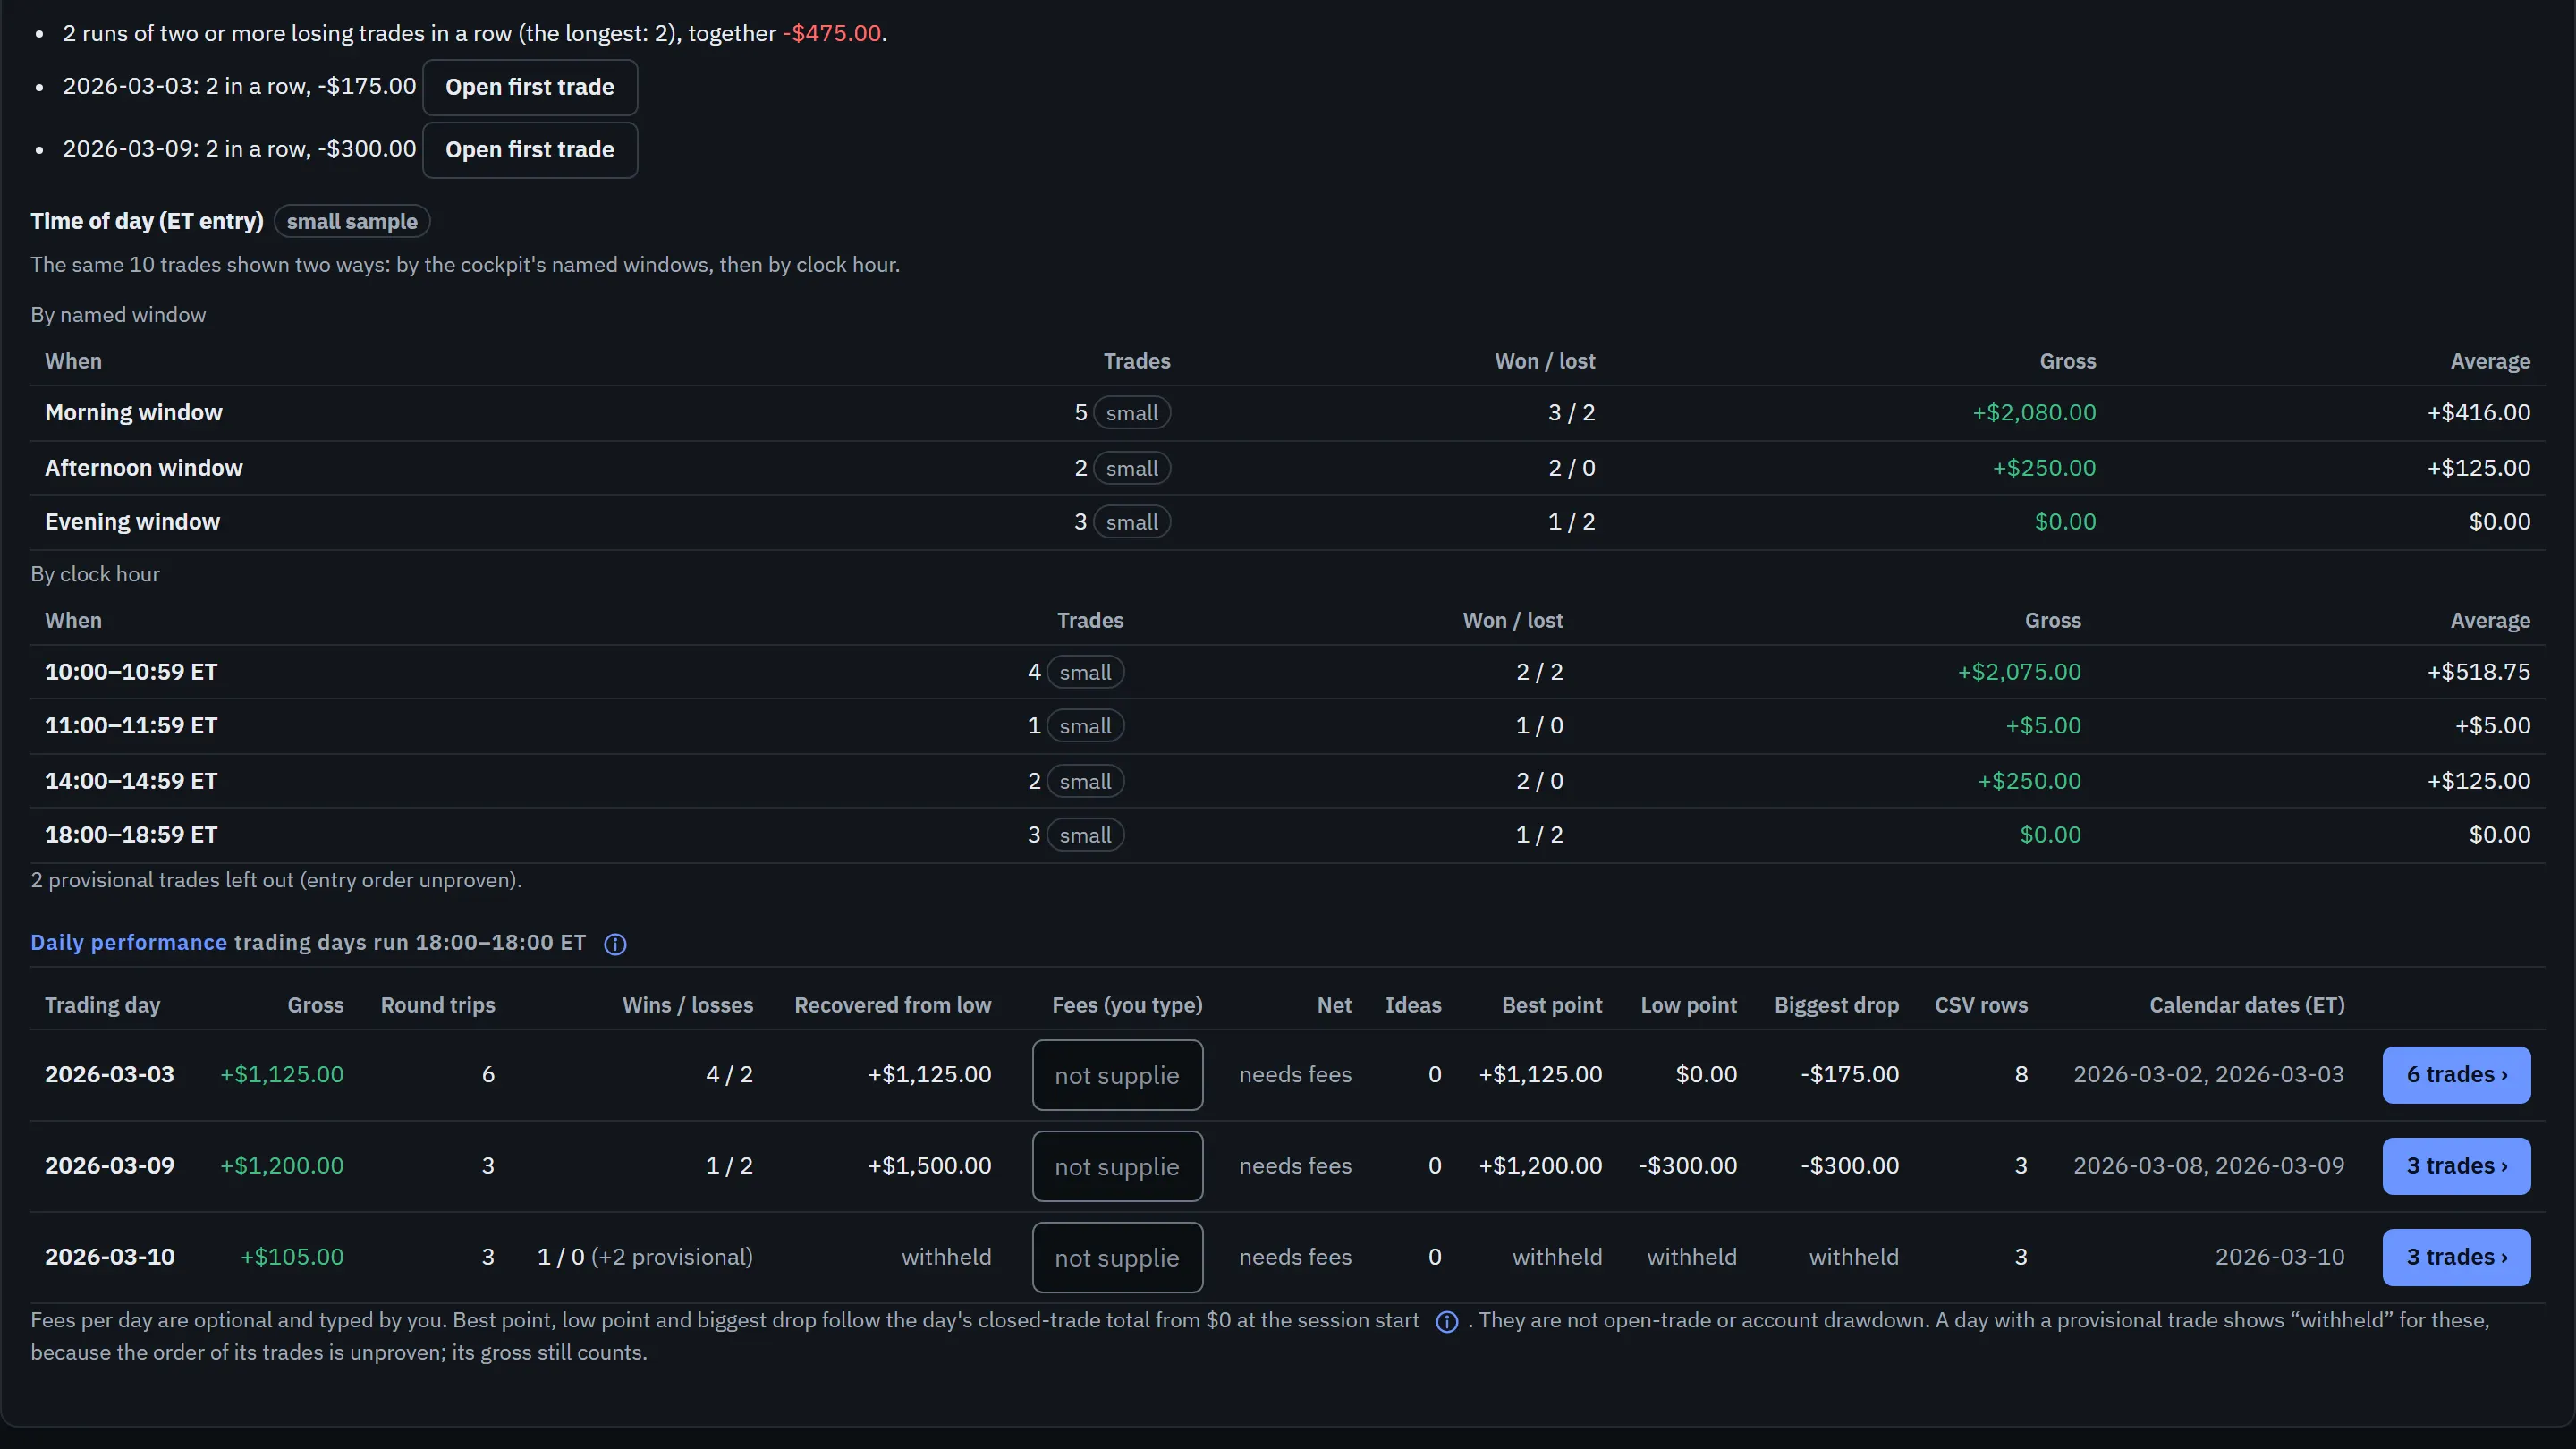
Pairing is a pure first-in first-out cycle walk. A fill that crosses flat contributes one leg that closes the old cycle and one that opens the next, so a reversal is two trips, not one. Scale-ins and scale-outs are legs of one trip. Fills in the same second cannot be ordered by the file, so the trip they belong to is marked provisional: its gross counts, but it is left out of win and loss counts and of any figure that depends on order. The browser copy of the walk is parity-tested against the server copy on the same fixtures.
The reconciliation gate
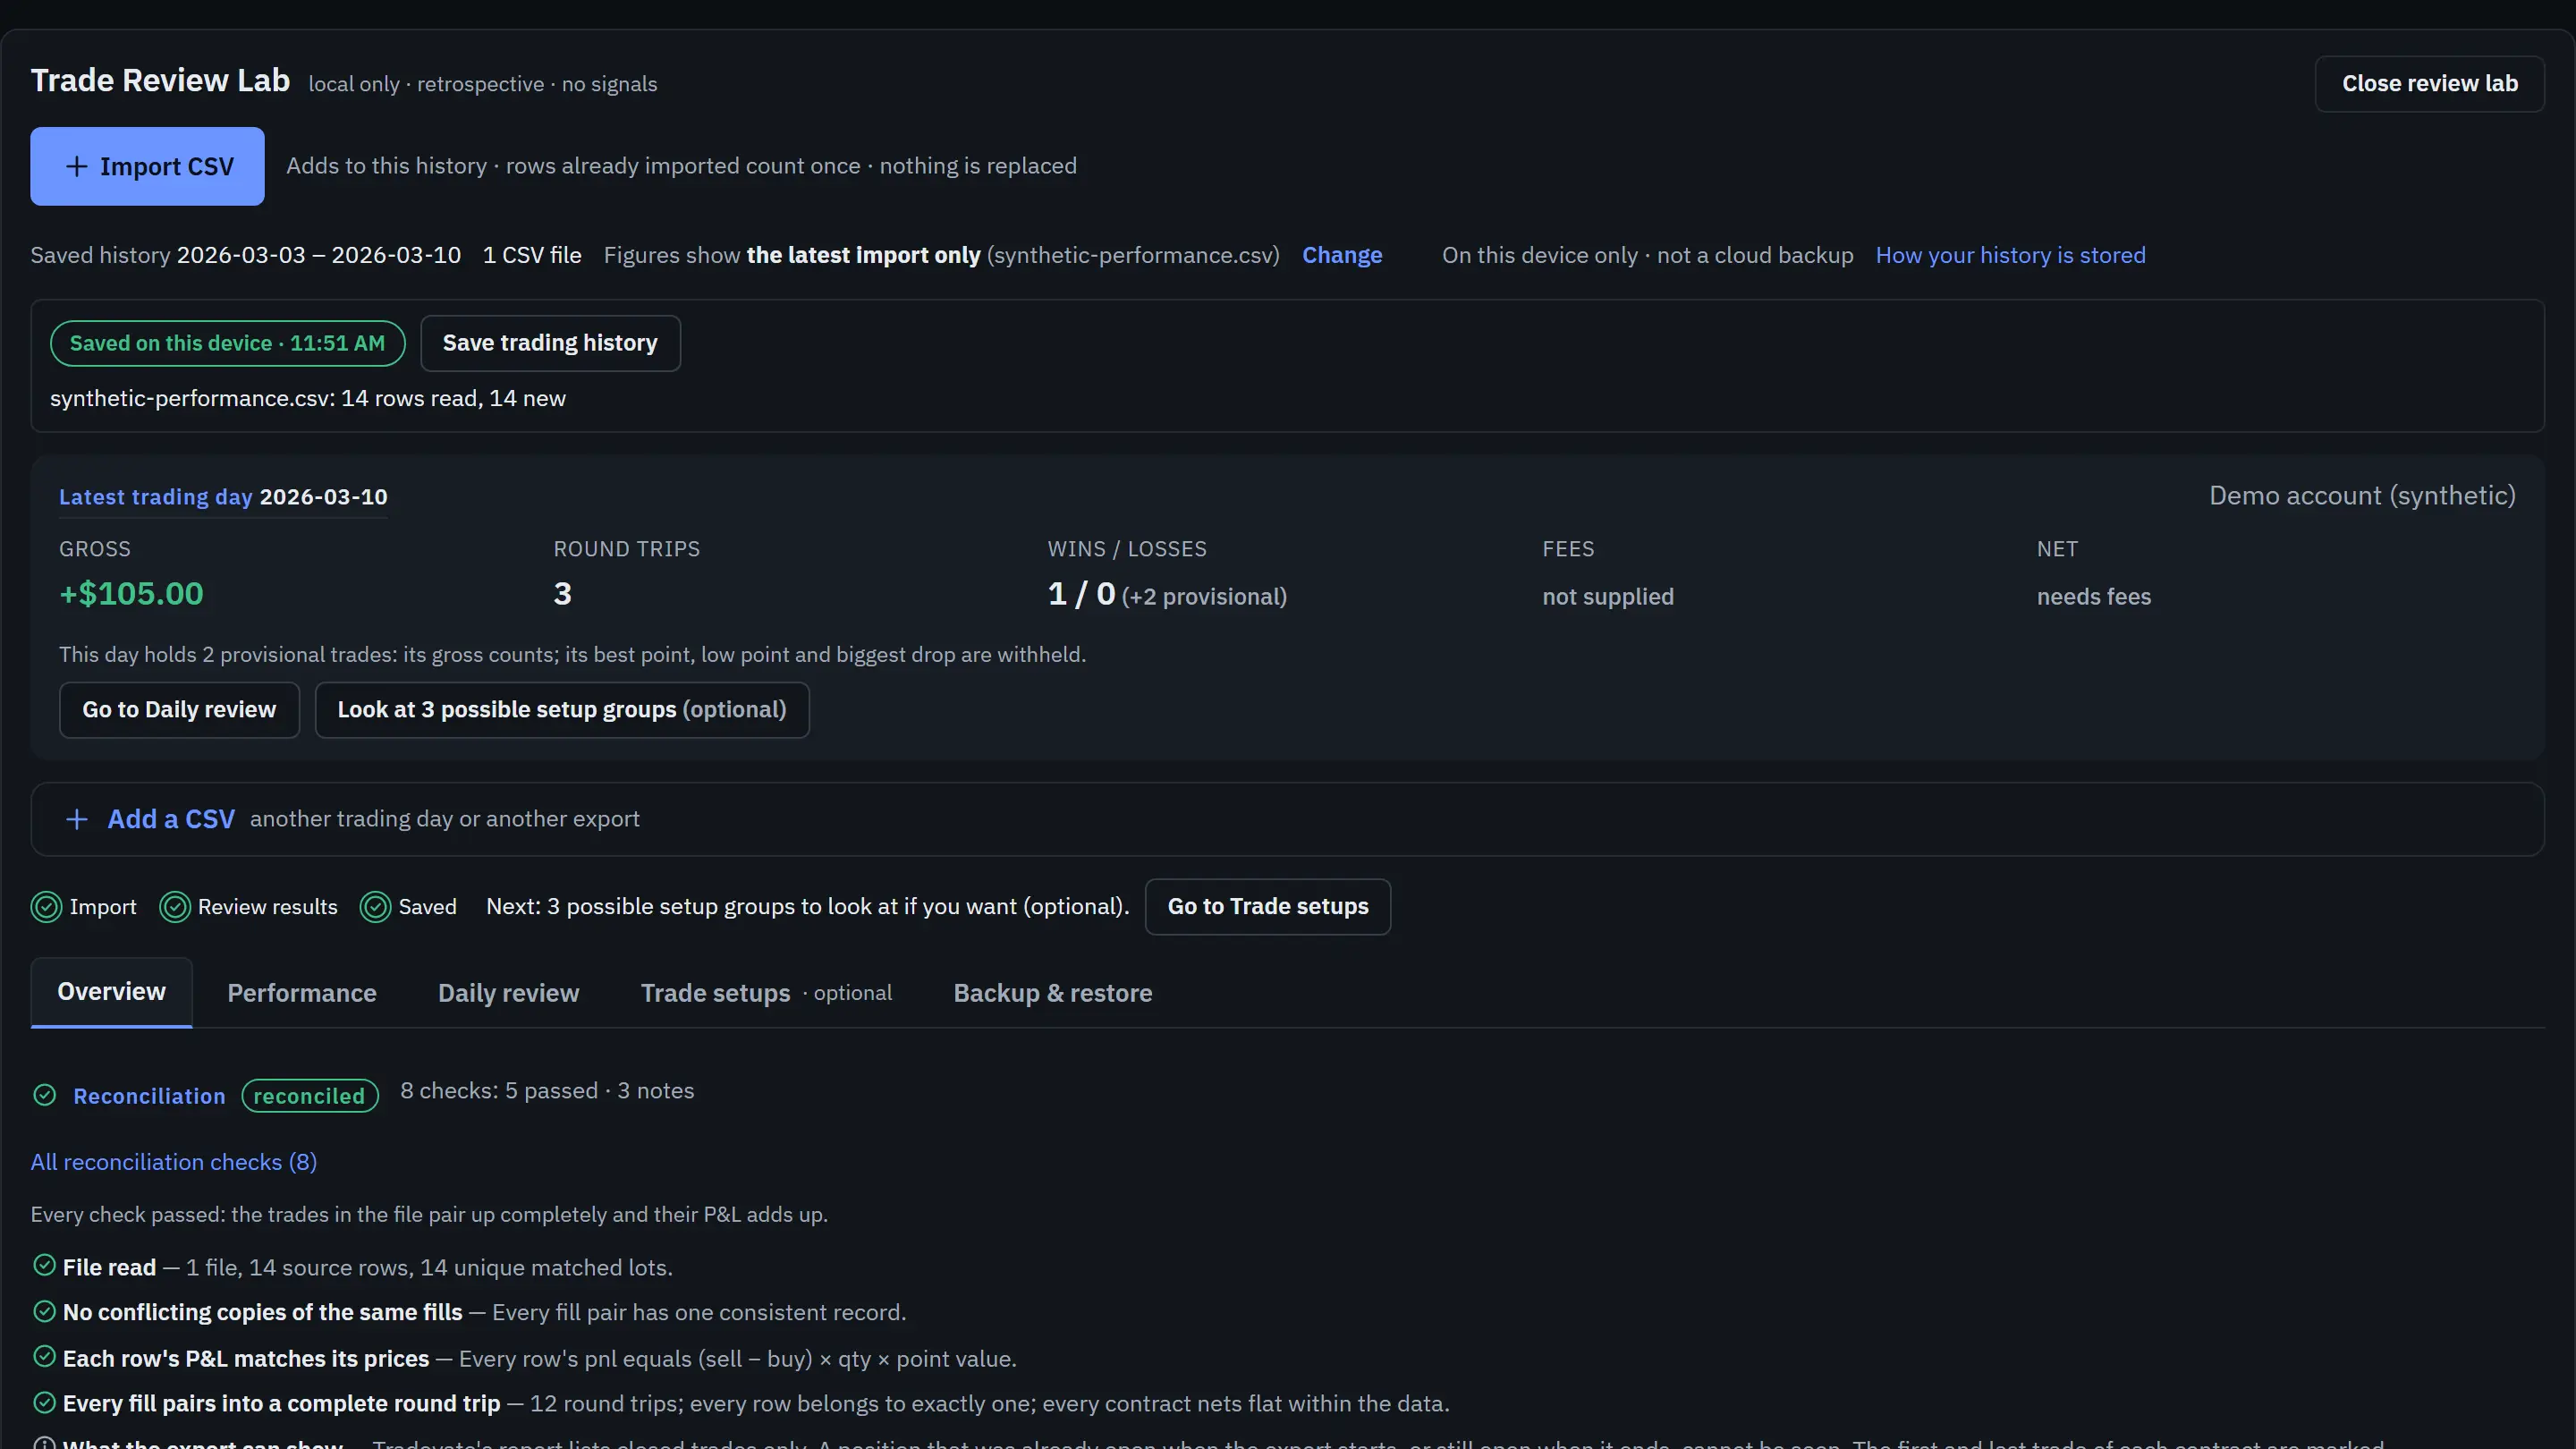
No aggregate is shown until the imported report reconciles to itself: no conflicting duplicates, every row’s reported profit equal to what its own prices give, every fill paired into a complete round trip, and totals that match any summary the trader typed from the broker’s own statement. A failed check blocks every total, rate and conclusion; the round trips stay visible with their flags.
Fees are never derived. The Performance export has none, so fee figures exist only when the trader supplies them, and a day’s fee is never spread across its trades. Net appears when the typed fees cover every day in the range, and the basis is stated beside it.
Performance and risk reporting
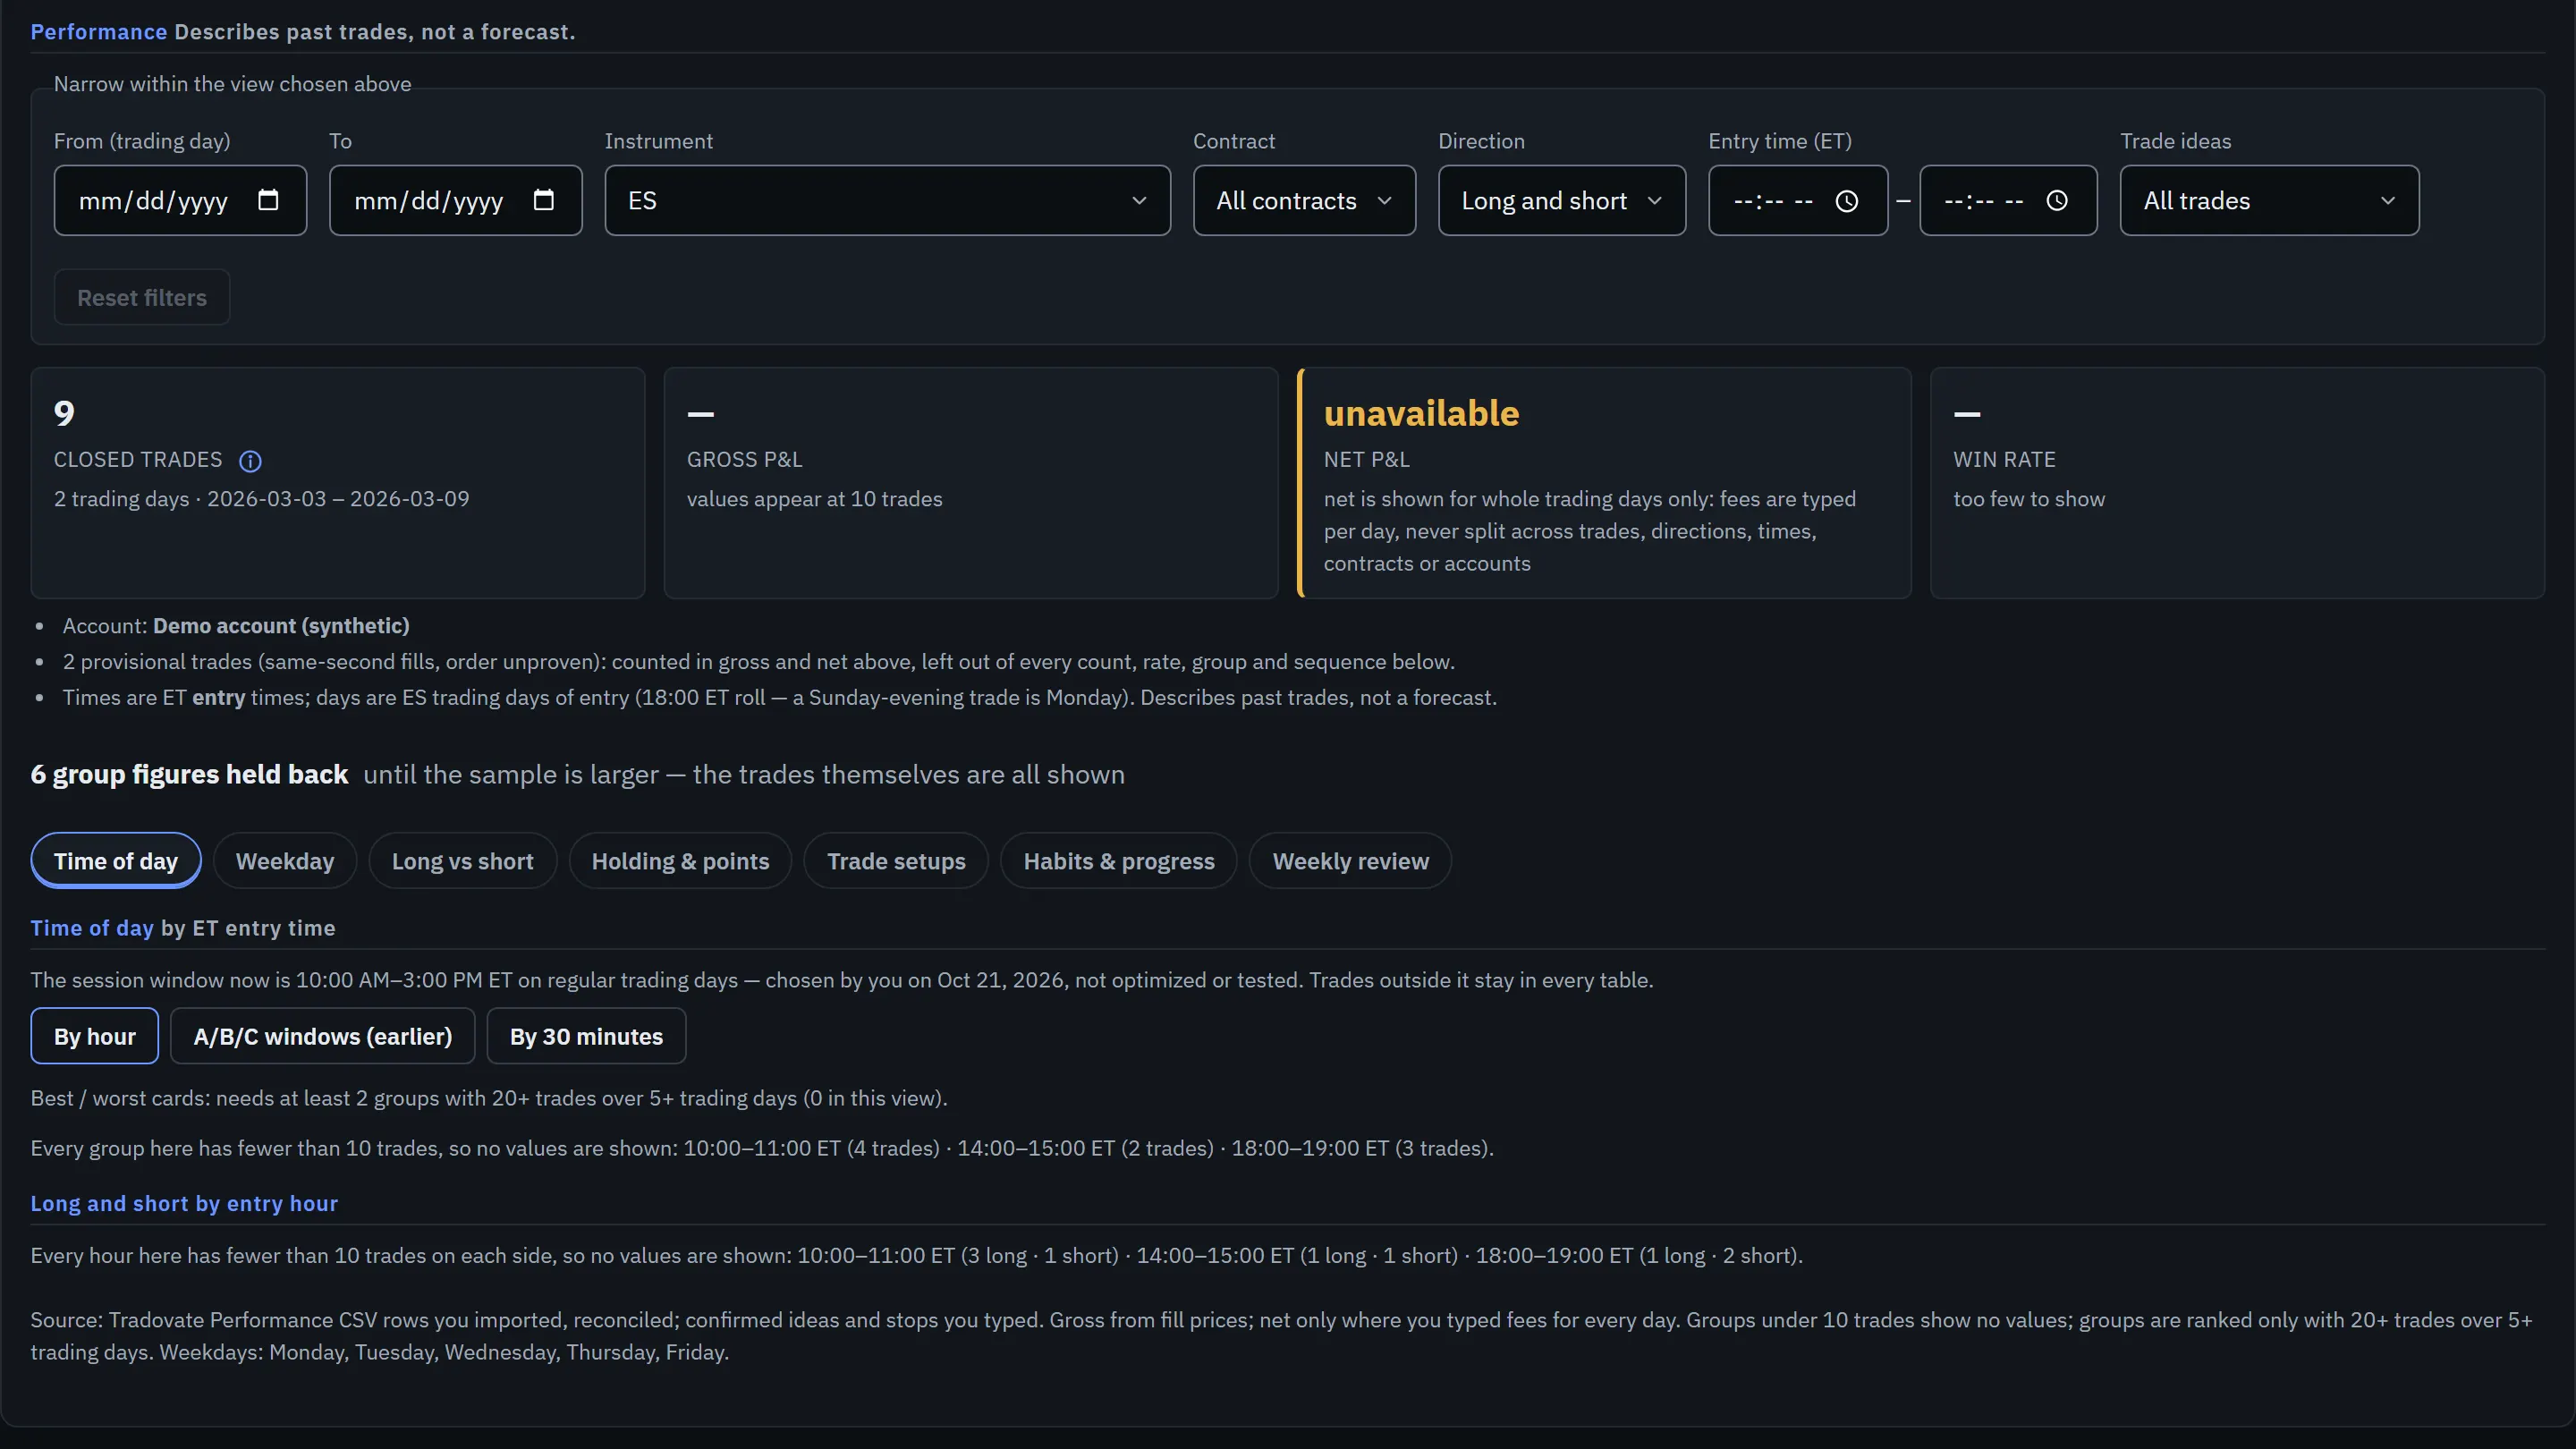
The analytics design was registered before any outcome was inspected, with thresholds that may not be tuned after seeing results. A time bucket may be ranked only with twenty or more settled trips over five or more distinct trading days; under ten, values are hidden and only the count is shown; between ten and nineteen they are muted and never ranked. Four “not shown” states are kept separate and never rendered as zero: low sample, fee data unavailable, risk missing, reconciliation failed.
Every bucket uses the entry time in Eastern Time with the 18:00 roll of the futures trading day, with tests for daylight-saving transitions and for the boundaries at 17:59:59 and 09:29:59. The wording is fixed too: “highest average so far” and “describes past trades, not a forecast”, never a forecast and never “you should”. Nothing in the analytics feeds a gate, a size suggestion or a configuration value.
Session declarations and risk intelligence sit beside the analytics. The trader declares the session’s trades after the fact; a loss budget is derived and shown as illustrative, never enforced; and every figure carries one of five provenance labels: user-entered, derived, CSV evidence, broker-verified, unverified.
Integrity and auditability
The trader’s history lives on the device, in IndexedDB, partitioned per signed-in user. Each imported file is fingerprinted with SHA-256 and the fingerprint travels with every record built from it, together with the line numbers and the app commit that built it. Journal records written to the cloud get a deterministic id derived from the account label, contract and opening fill, and are created with a create-if-absent transaction, so re-importing the same file, or two tabs confirming the same trade, can never produce a second record.
A history can be archived and restored. Every archive carries a checksum; a restore compares the file’s identity with the history it would replace and with every other history on the device, and asks before it would go back to an older revision, adopt a different identity or make a second copy. A backup bundle of all histories is read back entry by entry, checksummed and re-parsed before the download is offered. Erasing trading data writes a tombstone that locks every other open tab, so nothing a sleeping tab still holds is written back.
Built for a phone
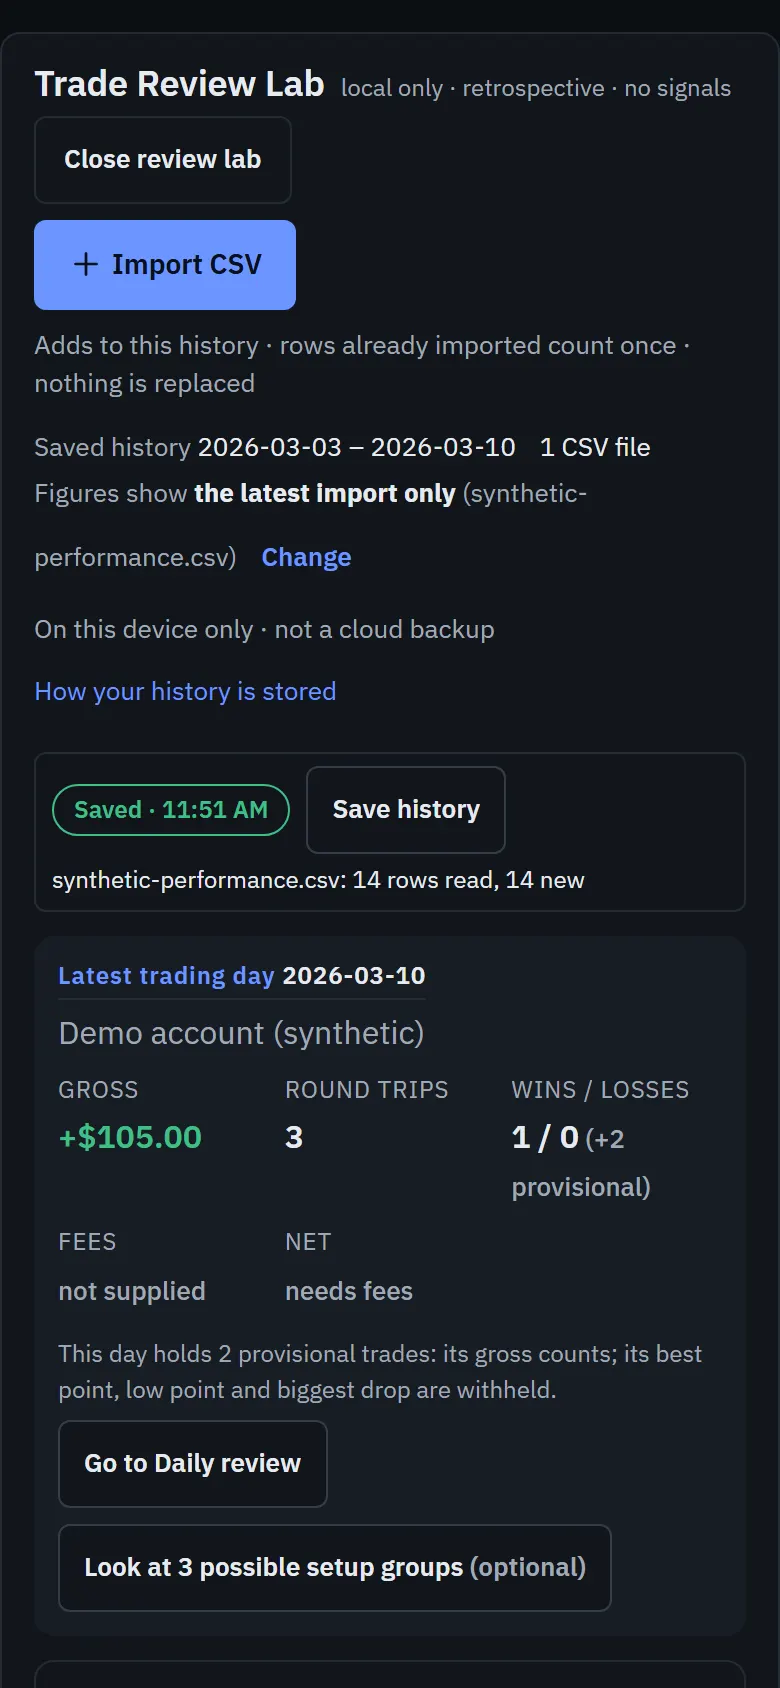
The app is designed at 390 pixels first and verified at 320, 375, 390, 430 and 1280 on two browser engines, with no horizontal overflow and 44-pixel targets. When the CSV-first release replaced a per-trade confirmation flow with automatic execution analytics, the measured phone journey on the synthetic case went from 63 taps and 53 confirmations to 4 taps and none, from opening the app to the first figures.
Limits and lessons
- No market data. The broker’s chart endpoint answers “Symbol is inaccessible” on this account: an entitlement gap, proven by resolving every contract id and still being refused. Historical candles from a data vendor were costed and found feasible, but the purchase is on hold, so the trade-detail chart says plainly that no candles are drawn, estimated or fetched. The candle pipeline is built and proven end to end on synthetic records only.
- A file cannot prove its own edges. An export lists closed trades only; a position open when the export starts or ends makes several smaller trips look complete. Trips on a file’s first or last day stay “needs flat check” until the trader confirms the account was flat, and that confirmation is recorded as the owner’s word, never as broker verification.
- Broker import is off. The account functions that once read balances and fills were switched off server-side in October 2026; current analytics are CSV-based and say “not broker-verified” wherever they appear.
- The lesson that shaped everything else: the honest version of a number is often “not shown, and here is why”. Keeping four distinct not-shown states cost more design than any chart, and it is the part I would build first again.
Status
The directive for this page asked for four things to be kept apart. They are, with the project record as the source for each.
| Status | What |
|---|---|
| Implemented, in the private deployment | CSV import with line provenance; lots to fills to FIFO round trips; the reconciliation gate; Daily review, findings and Performance with the registered sample thresholds; the Journal; session declarations and risk intelligence; device-local history archives with checksums; backup bundles with read-back verification; erase with a tombstone; single-owner sign-in. |
| Tested on synthetic data only | Every analytics figure’s golden tests; the phone journey measurement; the candle-pack pipeline from request file to chart; persistence of the flat-check answers across reloads. |
| Live, broker-verified | The account functions that read balances and fills ran against the owner’s broker account in earlier releases and are switched off since October 2026; the VIX proxy reads the exchange’s public history file. |
| Planned or blocked | Historical candle charts and automatic chart reconstruction (no provider connected; market-data entitlement refused; vendor purchase on hold); the discipline loop that passed its release gates on 2026-11-04, whose deployment is not recorded in the repository. |
Evidence and limitations
What is checkable from the repository: the modules named on this page, their tests (241 files, 3,437 passing on the project’s own record of 2026-11-03), the design documents that registered the thresholds, and the release records that measured the phone journey. The captures on this page come from the app’s development-only preview, which runs without sign-in and without any cloud connection, loaded with the repository’s own 14-row synthetic fixture: one contract, three trading days in March 2026, fictional fill ids. No real trading record, balance, account identifier or credential appears anywhere on this page.
What I do not publish: the hosting address, project identifiers, any trading outcome of my own, and any claim that the app makes money. The app is a private, single-user deployment behind email-and-password sign-in; there is no public URL to visit. Whether the latest version has been deployed is not recorded in the repository and is listed as pending.
Figures